Quantifiable Edges Blog
Quantifinder Info
Membership Info Main
Gold Membership
Silver Membership
About
Contact
The Quantifinder is Quantifiable Edges original technology. There is nothing else like it anywhere on the web. The Quantifinder was designed to automatically search through our database of published research and extract anything that is applicable to the current day's market action. This includes studies based on price, breadth, volume, leadership, and sector rotation. It looks at both daily and weekly data across a wide range of indices. All applicable studies are then published on the Quantifinder page, where you can easily see their bullish/bearish tendencies and a description of the research.
Below is a screenshot of the Quantifinder
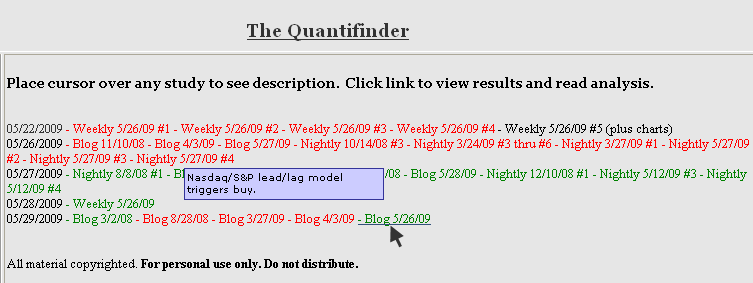
What you see is any research applicable to the last 5 days. Anything that shows up in green is bullish. Anything that shows up in red is bearish. Hover your cursor over a study, for instance “Blog 5/26/09” above, and you’ll see an information box appear. That box will tell you the parameters of the study. In this case “Nasdaq/S&P lead/lag model triggers buy.” If you want to see the study details and what I wrote about it then simply click the mouse and the 5/26/09 blog post will appear.
What's Not In The Quantifinder?
Very little is not included in the Quantifinder. One thing you won't find is repeated studies. If a study was discussed more than one time on the blog or in the Subscriber Letter, then the most up-to-date results are linked to. Certain studies that we feel are no longer significant or are unlikely to provide an edge are also excluded. An example of this would be the October 6, 2008 blog study that looked at instances where the VIX closed over 40 for 2 days in a row. The VIX then remained above 40 for most of the following 6 months, thereby deeming this study irrelevant. Also not included are intraday studies. The most prominent of these on the blog include studies that look at intraday performance following large gaps. Lastly, studies related to our proprietary Catapult and Spyx indicators are not now available. This is due to the fact that the data currently used to calculate these indicaotrs isn't available until 8pm. This may change in the future. Other than that, almost every published study is included.Ready to Subscribe?
Please proceed to the membership pages to subscribe.Gold Membership
Membership Info Main
Questions?
Support@quantifiableedges.com* While meticulous care was taken and everything was checked multiple times to ensure accuracy with the Quantifinder, the only guarantee is that I made a mistake somewhere.
Early Subscriber Reaction
"I am sure that this new
functionality of your service provides much much much value for your
European subscibers like me. I am not a full-time trader (yet). I can
read your subscriber letters during working hours only ( 2 am Eastern
Time = 8 am Central European Time).
I am so happy! Thanks Rob.
Best,
Peter
(Budapest, Hungary)
"No need to reply, but this is fantastic. Will have to give in and finally be a twitterer !"
- David B
-Bill S.
"It looks extremely useful and seems like a great way for us non-eastern time zone traders to get a start on the next day. The amount of data you track and interpret continues to amaze-
-Dan
"This is superb. You are really good."
-Saurabh S
"Very cool! Thanks again."
- Ram A
Questions?