Quantifiable Edges homepage
Click here to purchase
Questions?
email:
BigTimeSwing@quantifiableedges.com
or call
781-956-6952
|
The Quantifiable
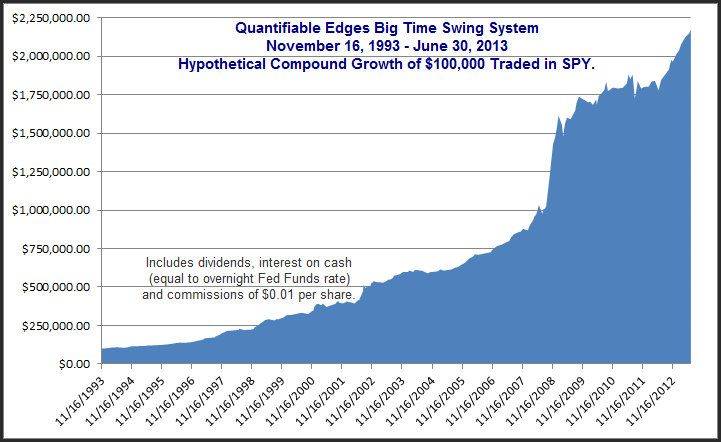
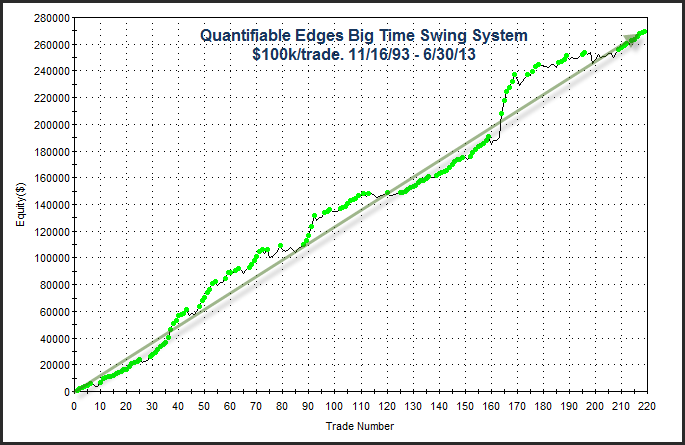
Edges Big Time Swing System Here’s how $100,000 would’ve grown using SPY over 19.5 years from 1993 – 6/30/13.
Note that a "0.5" trade means it spanned both years.
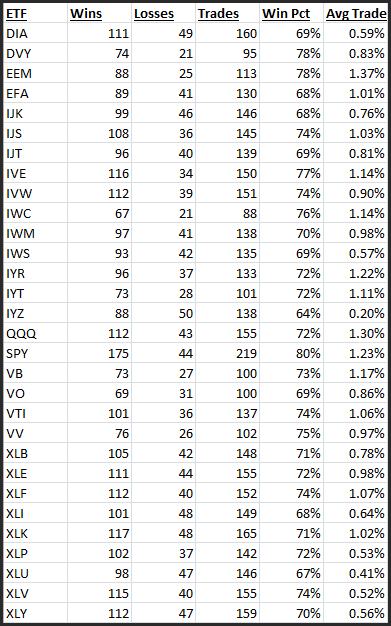
The QE Big Time Swing System is robust
Tradestation code will be available for an additional fee. (And it is all open-sourced and customizable.) Get
a Quantifiable Edge for
2013 and beyond. The Big Time Swing System is now available
for $1,750. The open-sourced Tradestation code is an additional $50. The Excel Spreadsheet with calculations and code is also $50. Both may be purchased together for $75. (Code is only available to buyers of the system.) Traders may use the code to customize the system or expand on the ideas. A section of the manual discusses some ideas for further customization/enhancement.
Questions? BigTimeSwing@quantifiableedges.com The NFA requires us to state that “HYPOTHETICAL OR SIMULATED PERFORMANCE RESULTS HAVE CERTAIN INHERENT LIMITATIONS. UNLIKE AN ACTUAL PERFORMANCE RECORD, SIMULATED RESULTS DO NOT REPRESENT ACTUAL TRADING. ALSO, SINCE THE TRADES HAVE NOT ACTUALLY BEEN EXECUTED, THE RESULTS MAY HAVE UNDER- OR OVERCOMPENSATED FOR THE IMPACT, IF ANY, OF CERTAIN MARKET FACTORS, SUCH AS LACK OF LIQUIDITY. SIMULATED TRADING PROGRAMS IN GENERAL ARE ALSO SUBJECT TO THE FACT THAT THEY ARE DESIGNED WITH THE BENEFIT OF HINDSIGHT. NO REPRESENTATION IS BEING MADE THAT ANY ACCOUNT WILL OR IS LIKELY TO ACHIEVE PROFITS OR LOSSES SIMILAR TO THOSE SHOWN.” Except where otherwise specifically stated, all trades are based on hypothetical or simulated trading. Hypothetical or simulated performance results have certain inherent limitations. Unlike an actual performance record, simulated results do not represent actual trading. Also, since the trades have not actually been executed, the results may have under-or-over-compensated for the impact, if any, of certain market factors, such as lack of liquidity. Simulated trading programs in general are also subject to the fact that they are designed with the benefit of hindsight. No representation is being made that any account will or is likely to achieve profits or losses similar to those shown. Commissions, fees, and slippage have not been included. This is neither a solicitation to buy/sell securities or listed options. This system and accompanying manual and other information has been prepared by Hanna Capital Management, LLC and is provided for information purposes only. Under no circumstances is it to be used or considered as an offer to sell, or a solicitation of any offer to buy securities. While information provided is believed to be accurate at the time of publication, we make no representation as to the accuracy or completeness of any data, studies, or opinions expressed and it should not be relied upon as such. Robert Hanna, Hanna Capital Management, LLC or clients of Hanna Capital Management, LLC may have positions or other interests in securities (including derivatives) directly or indirectly which are the subject this system and accompanying manual and other information. All system information is provided solely for the knowledge of Hanna Capital Management, LLC clients and prospects who are expected to make their own investment decisions without reliance upon the system. Neither Hanna Capital Management, LLC nor any officer or employee of Hanna Capital Management, LLC accepts any liability whatsoever for any direct or consequential loss arising from any use of this system or information included with it. No system information may be reproduced, distributed or published by any recipient for any purpose without the prior express consent of Hanna Capital Management, LLC. |